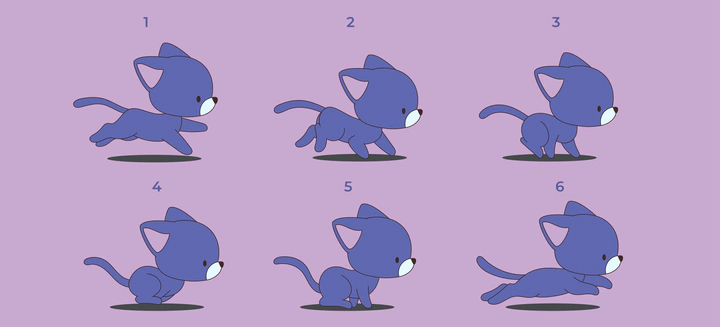
Creating GIFs with code

How can you make a GIF using code?
Grades 5 - 8
A GIF is essentially a collection of individual, successive images or snapshots, which are then “played” in sequence as frames in a movie. For graphing purposes, they can be used to show changes over time or to highlight specific aspects of a data set.
This week, we hope to inspire you with the following visualizations: a growing red circle on a blue background, and an animation that is more data-oriented.

Can we create a GIF within Python?
To answer our question, here is the key Python code to create a GIF:
# A function definition in Python
def make_box_gif():
    frames = [ ]
    for num in range(11):
    frames.append(box(num))
    frame_one = frames[0]
    frame_one.save("box.gif",format="GIF",append_images=frames,
    save_all=True, duration=200, loop=0)
In the code above, we provide an example of Python code that creates a growing circle animation. The code draws each frame for the animation, then saves it in the “GIF” format, which can then be used in web pages, documents, or other apps.
The animation below shows the individual frames that were created one by one, on the left, then put together on the right as a single “movie.” This movie is essentially made up of a series of frames that run together to show a growing circle.

In the following GIF, we investigated the interest rates in Canada and visualized the trends in the 21st century.

To learn more about creating GIFs with Python check out our Jupyter Notebook.
Reflect on what you see
Look and examine the animation above.
Think about the following questions.
- How many frames do you see stacked on the left?
- Can you count the same number of frames on the animated video on the right?
- About how many frames per second appear in the animation?
- How might you make the animation smoother, and less jerky?
- In the Python code, can you find the loop that creates the frames?
- How many frames are created in that loop?
- What do you think the “append” function does?
- In the Python code, can you find the function that saves the GIF file?
- What is the name of the file?
- What do you think “duration=200” means? What time units are used here?
- How might you use this to create the mathematical plot in the example above?
Use the fill-in-the-blank prompts to summarize your thoughts.
- “I used to think _______”
- “Now I think _______”
- “I wish I knew more about _______”
- “These data visualizations remind me of _______”
- "I really like _______”
Learn how we visualized the data
Go to our walk-through (in our Jupyter notebook) to see how we used the data science process (formulating a question, gathering the data, analyzing the data with code, and creating the visualizations) to create the line graph.