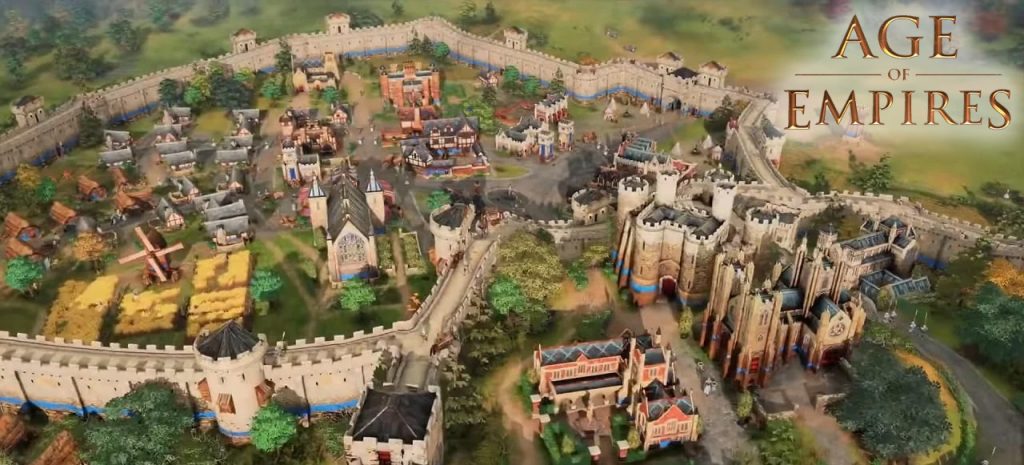
How long does it take to build different monuments, from different eras, in Age of Empires?
Grades 6-12
Age of Empires, a series of historical, real-time strategy video games, was originally released in 1997. Part of the game focuses on building historically significant monuments from around the world, in collaboration with others.
In building these historical monuments, players can experience what it must have been like to construct actual ancient architecture. Their characters advance through succeeding civilizations by building these structures. To construct these monuments, players must take into consideration how long they take to build (“time units”), as well as the type and amount of resources (wood, stone, gold, etc) needed to build the structures.
Players can advance through four main ages: Dark, Feudal, Castle and Imperial, each with a unique set of structures to build. The more the player advances, the more structures they have to build, and the more complex those structures become.
This game setup made us wonder: what is the average time taken to build a structure in each of the four ages?
To answer our question we:
- Gathered data from an “API” (an application programming interface) — a mechanism that allows users to extract data from a database and parse it into a table (a “dataframe”) using Python and Jupyter notebooks.
- Created a box plot graph — a type of data visualization that shows the minimum, maximum, sample median, and the first and third quartiles of the data.
In the first plot, it looks like there is one data point for a structure called “Wonder” that distorts (or, to use statistical language, “skews”) the data. This data point increases the average time to build structures in the Imperial age.
If we remove the “Wonder” data point, we have a clearer view of how long the other structures take to build in each of the four ages.
We can now see the median build time for structures across all ages is comparable (between 35-45 time units). A data point like the “Wonder” is known in statistics as an “outlier”, that is, a data point that differs significantly from other data points in the set of observations.
Reflect on what you see
Look and interact with the box plots above. When you hover your mouse over the plots, you’ll notice more information appears. You can also use the legend to make plots appear and disappear.
Think about the following questions:
- What do you notice about the box plot graphs?
- What do you wonder about the data?
Use the fill-in-the-blank prompts to summarize your thoughts:
- “I used to think_______”
- “Now I think_______”
- “I wish I knew more about_______”
- “These data visualizations remind me of _______”
Learn how we visualized the data
Go to our walk-through (in Jupyter notebook format) to see how we used the data science process to create the line graph. (This process included formulating the question, gathering the data, analyzing the data with code, and creating the visualizations.)

